Visualizations for Adaptive Training#
The following visualizations relate to the linear form of the training. The sections For Instructors and For Trainees, respectively, describe the purpose and means of the visualizations.
For Instructors#
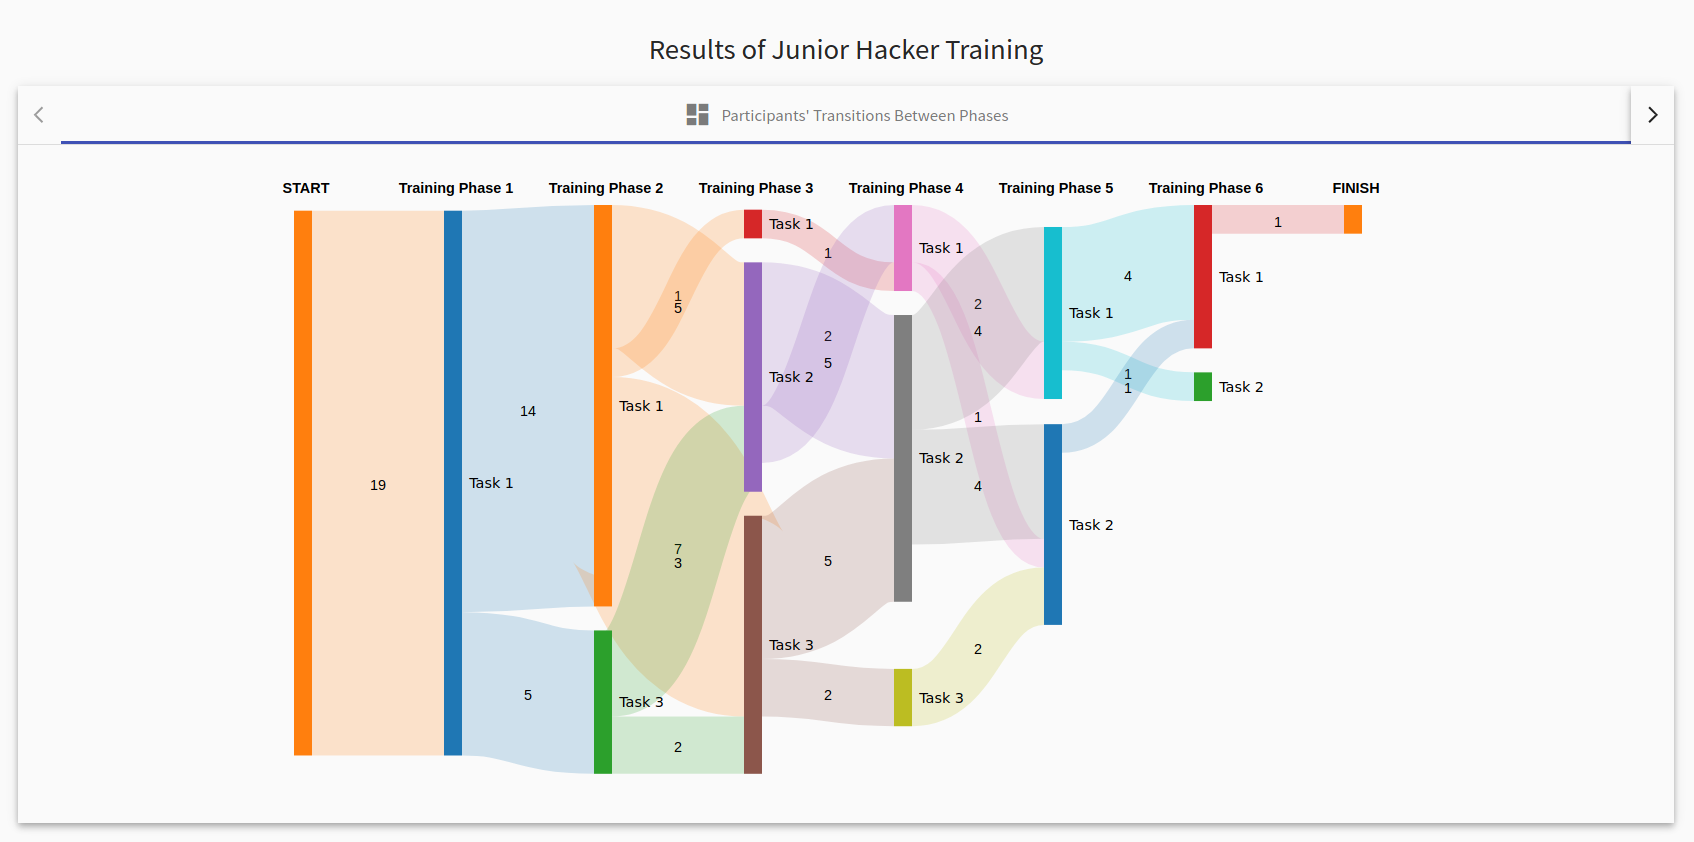
Sankey Diagram#
Diagram represents the participant’s transitions between the tasks of the respective training phases. Each transition also contains the number of participants.
For trainees#
Adaptive transition visualization#
After trainees finish a training run, a visualization of their behavior is displayed. It helps the trainees examine their path through training and compare tasks assigned to them with other potential tasks. The colored line and its nodes represent the trainee’s path through training. X-scale contains training phases, while y-scale represents tasks ordered by their difficulty.
Each task can be viewed by clicking on the respective node in visualization. Its content is displayed below visualization, allowing for easy comparison between tasks in phases.
![]()