Sandbox Monitoring
KYPO CRP supports sandbox monitoring functionality. These resources can be currently monitored:
- Operating System resources via Node Exporter respectively Windows Exporter
- ICMP network availability of management IP addresses
- TCP port availability of selected network interfaces
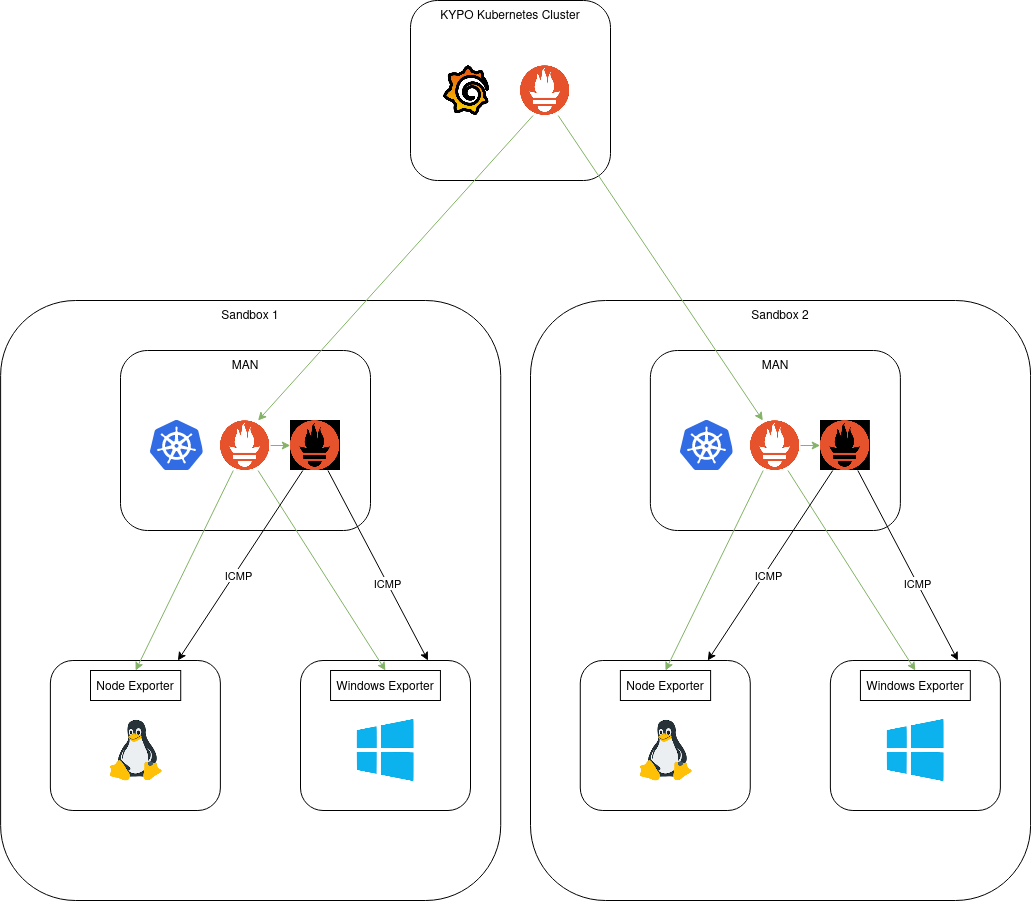
This is the architecture of the monitoring solution:
Deployment#
Monitoring can be deployed with KYPO deployment tools together with the deployment of KYPO CRP. To enable monitoring, set the following variables in tfvars file:
- enable_monitoring - set to true
- man_flavor - each man node hosts monitoring components. Using a flavor with 2 CPUs, 4 GB of RAM, and 80 GB HDD is recommended.
- os_region - set the region used by KYPO CRP in the OpenStack project.
- openid_configuration_insecure - set to true if KYPO is not using tls certificate from a trusted CA.
Operating System Monitoring#
KYPO is able to automatically deploy Operating System monitoring based on monitor-os group in topology.yml. Available settings:
- undefined - no Operating System monitoring will be performed.
- list of hosts or routers - only specified hosts/routers will be monitored.
- [] - all hosts and routers will be monitored.
ICMP network availability#
KYPO is able to automatically check ICMP network availability based on monitor-icmp group in topology.yml. Available settings:
- undefined - no ICMP monitoring will be performed.
- list of hosts or routers - only specified hosts/routers will be monitored.
- [] - all hosts and routers will be monitored.
TCP port availability#
KYPO is able to check the availability of TCP ports on specified network interfaces of hosts and routers in topology.yml by including monitoring_targets section.
Monitoring dashboards#
Monitoring dashboards can be accessed at https://kypo-fqdn/grafana. The default username is admin. Password is autogenerated by the deployment and can be retrieved by running following command in the deployment directory:
terraform output -raw monitoring_admin_password
The following dashboards are available in the KYPO folder:
- Node Exporter Full - Linux Operating System metrics
- Windows Exporter Dashboards - Windows Operating System metrics
- ICMP exporter - ICMP metrics
- Sandbox network availability - ICMP and TCP network availability